
Human settlement
- Settlements refer to the process of people grouping together and acquiring some territory for the purpose of building homes, and for their economic support. It refers to any form of human settlement, which can range from a single dwelling to a large city.
| Isolate Dwellings or Detached housings | Such settlement consists of individual units. It can be termed as the initial state of developmentof a settlement.An isolated dwelling would only have 1 or 2 buildings of families in it. |
| Hamlets/ parish settlement | When many individual units are clustered together, they form hamlets. The grouping may be due to similar occupation patterns, religion, cultural factors etc.A hamlet has a tiny population. |
| Villages | When many hamlets combine they form a village. The reason for such grouping may be due to interdependencies of one hamlet on another, thus to form a self-sufficient unit. |
| Towns | A town is a larger entity which is more self-sufficient and has a stronger economic base. |
| City | A place where a large population of people resides and there is an opportunity for many economic activities. |
| Metropolitan | A metropolis is a large city whose urban population is at least 1 million. |
| Megalopolis | A large metropolis or a long chain of metropolitan areas. |
| Exopolis | This term is used for the new concept regarding the expansion of large cities. The term Exopolis is coined by Edward Soja.Exopolis is a city that no longer expresses the traditional qualities of a city. High growth can be seen in the outer cities and edges of the city which led to more urbanization.The most prominent example is Los Angeles. |
- Rural settlements
| i | Compact / clustered settlements | In these all the houses are built close to each other.Therefore in such settlements all the residential areas are concentrated in a central place and the inhabited areas are separated from the fields and pastures.Most of the settlements in our country fall in this category. These are spread in almost every region of the country. |
| ii | Semi compact/semi clustered settlements | The dwellings or houses are not well built.The characteristic of this type of settlements is that they are small but dense and concentrated. They occupy more area than compact settlements.This type of settlements are found in both plateaus and plains (depending upon the environmental conditions prevailing in that area). |
| iii | Purwa/Palli settlements | Such settlements are divided into many smaller units.The main settlements do not have much influence.Many times the original site cannot be easily identified and these settlements are often spread over an area with intervening areas.This separation is often influenced by ethnic and social factors. |
| iv | dispersed settlements | These are also called isolated settlements.These settlements are characterised by small units which may consist of a few houses or a small group. These may contain two to seven huts.Hence such settlements are spread over a large and wide area with no particular pattern. |
- Urban Settlements
- The definition of urban areas was revised in 2011 according to which urban areas are composed of two types of administrative units – Statutory Towns and Census Towns.
| Statutory Towns | All administrative units that have been defined by statute as urban like Municipal Corporation, Municipality, Cantonment Board, Notified Town Area Committee, Town Panchayat, Nagar Palikas etc., |
| Census Towns | Administrative units satisfying the following three criteria simultaneously are treated as Census Towns as mentioned below:A minimum population of 5000;At least 75 percent of male working population engaged in non-agricultural sector;A density of population of at least 4,000 persons per square kilometre. |
| City | Statutory Towns with a population of 1,00,000 and above are categorised as cities. |
| Outgrowth | An Out Growth (OG) is a viable unit such as a village or a hamlet or an enumeration block made up of such village or hamlet and clearly identifiable in terms of its boundaries and location.Some of the examples are railway colony, university campus, port area, military camp, etc. |
| Metropolitan Cities | Cities with a population of one million and over are known as metropolitan cities.The main activities in these cities are industries, trade, commerce, transport, cultural and political.The number of metropolitan cities increased from 12 in 1981 to 53 in 2011. |
| Mega Cities | Cities with a population of 10 million and above are known as mega cities, according to the Census of India.But the United Nations considers mega cities as those that have a population of 10 million and above. In India, Greater Mumbai, Kolkata and Delhi are examples of mega cities. |
| Suburban Expansion(Conurbation) | This term was coined by Patrick Geddes. It comes into being by coalescence of urban settlements which were separated by open space in the past.The coalescence usually occurs through Ribbon Development along the main interurban transport routes. Mumbai, Delhi and Kolkata are good examples of conurbations in India |
| Metropolitan(Megalopolis) | It is just like conurbation and is formed when a large city of Boston sprawls and brings into its fold, the smaller adjacent towns and cities.This term was first used by Gottman in 1964 |
Problems of Indian Urbanization
- This high growth rate of population is the cause of many social, economic and environmental problems. Some of the main problems of Indian urbanization are briefly as follows :-
| Lack of space | Due to increasing population, more space is required for housing etc., which is not easily available due to physical and geographical pressure.When cities grow, colonies start coming up towards the periphery or in rural areas. This puts a lot of pressure on prime agricultural land and this land is encroached upon to build housing etc. for the increasing population. |
| Inadequacy of houses for residence | There is a rapid increase in urban population in developing countries, which is leading to a shortage of houses. According to an estimate, there is a shortage of about 1.7 million houses every year in Indian cities. |
| Lack of social amenities | Due to concentration of people in urban areas, social amenities such as housing, electricity, drinking water, transport, sanitation, sewage treatment, educational institutions, hospitals, parks, playgrounds and recreational facilities are getting more stressed.In fact, the population of cities is increasing but the infrastructure and civic amenities are inadequate. |
| Growth of slums | These are low-level temporary settlements, which lack basic services. Slums consist of one or two room huts which are mostly located on government and public lands, private lands, along railway lines, roads, canals and in old areas of cities. |
| Pollution | Over the years, clusters of cities have come up, where the number of industries and vehicles has increased tremendously. As a result, the quality of the urban environment has deteriorated a lot. This deterioration has occurred due to pollution of air, water, noise and waste materials. This has adversely affected the health of the city dwellers. |
| Transportation problem | Transport congestion are the major problems of Indian cities. Delhi has the best position in terms of road transport among the cities of the country, where the average length of roads per 100 square km area is 1,284 km (Chandigarh 1,260 km, Ahmedabad 680 km, Mumbai 380 km). Most of the roads in Delhi have more traffic than their capacity. |
| Water supply problem | Water is very important in human life. Without it, man cannot survive. This is the reason why cities have been established near water sources since ancient times. Modern cities require a large amount of water for domestic and industrial needs. |
Population
- Population is the most important resource of any nation which not only makes the use of natural resources possible but also paves the way for economic development through skilled, trained and hardworking labour force. In fact, the real strength of a country depends on the quality of its manpower.
- The distribution of population in a region depends on other factors such as social, cultural, economic, demographic etc. in addition to physical factors. 17.7% of the world’s population lives in India. 20% of the population is found in the northern plains and 20% in the coastal plains which shows dependence on natural factors because these regions have fertile alluvial soil as well as favorable climate. But social, cultural, religious and economic factors also have a wide impact on the population growth here.
- In fact, as economic development accelerates and industrialization and urbanization increase, the importance of economic factors increases in place of physical factors. Although India has vast natural resources still awaiting their development, it still has the problem of relative overpopulation.
- According to 2011 census population of India is at 1.21 billion which is equivalent to 17.70% of the total world population.
- India ranks number 2 in the list of countries (and dependencies) by population after china.
- According to estimates in a recently released United Nations report, India is expected to add 273 million people by the year 2050.
- Decadal Growth rate of Population in India between 2001- 2011 was 17.64%. It decreased from 21.54% during 1991- 2001.
- India’s population is larger than the total population of North America, South America and Australia put together.
| Terms | Definition |
| Crude birth rate | The annual number of live births per 1,000 people. |
| General fertility rate | The annual number of live births per 1,000 women of childbearing age (often taken to be from 15 to 49 years, but sometimes from 15 to 44). |
| Age- specific fertility rate | The annual number of live births per 1,000 women in particular age groups (usually 15- 19, 20-24 and so on). |
| Crude death rate | The annual number of deaths per 1,000 people |
| Infant mortality rate | The annual number of deaths of children of age less than 1-year-old per 1,000 live births. |
| Life expectancy | The number of years which an individual at a given age can expect to live at present mortality levels. Life expectancy of India is 69.16 years (2017). |
| Total fertility rate | The number of live births per woman completing her reproductive life, if her childbearing at each age reflected the current age-specific fertility rates. |
| Gross reproduction rate | The number of daughters who would be born to a woman completing her reproductive life at current age-specific fertility rates. |
| Net reproduction rate | The number of daughters who would be born to a woman according to current age- specific fertility and mortality rates. |
| Maternal mortality rate (MMR) | Defined as the number of maternal deaths per 100,000 live births due to pregnancy or termination of pregnancy, regardless of the site or duration of pregnancy. |
| Population pyramid | Also called an “age-gender-pyramid”, is a graphical illustration that shows the distribution of various age groups in a population (typically that of a country or region of the world), which forms the shape of a pyramid when the population is growing. |
| Sex ratio | The number of females per thousand males is referred to as sex ratio. |
| Child mortality rate | Number child deaths under the age of 5 years per 1000 live births. It’s about 50 in 2016.SDG Target – 11 |
| Dependency ratio | Measure of the number of dependents aged zero to 14 and over the age of 65, compared with the total population aged 15 to 64. |
| Demographic window | Defined to be that period of time in a nation’s demographic evolution when the proportion of population of working age group is particularly prominent |
| Demographic dividend | The economic growth potential that can result from shifts in a population’s age structure, mainly when the share of the working-age population (15 to 64) is larger than the non- working-age share of the population (14 and younger, and 65 and older). |
GROWTH OF POPULATION
- It is the change in the number of people living in a particular area between two points of time. Its rate is expressed in percentage.
- The growth rate of population in India over the last one century has been caused by annual birth rate and death rate and rate of migration and thereby shows different trends.
| Natural Growth Rate | difference between the crude birth rates and death rates between two points of time . |
| Induced Growth Rate | volume of inward and outward movement of people in any given area. |
Population Growth in India
(1) General Growth (1891-1921): In the three decades before 1921, the growth rate was very low due to the outbreak of famine and infectious diseases. In the decades of 1891-1901 and 1911-21, a decrease in population was actually observed. Since the population growth was very low before 1921, therefore, 1921 is also called the Great Divide Year of India’s population. By this time, India was going through the first phase of demographic transition. The birth rate was 48-49/1000 and the death rate was 42-48/1000 persons.
(ii) Moderate Growth (1921-1951 A.D.): In the three decades after 1921, famines decreased due to increase in agricultural production and expansion of transport facilities. Infectious diseases were prevented. As a result, in 1951, the birth rate came down to about 40/1000 persons and the death rate to 27.4/1000 persons.
(iii) Rapid growth (1951-2011): If 1921 is called the Great Divide Year of India’s population, then 1951 can be called the initial year of massive population growth. After this, the growth rate and net growth of population have been surprisingly high. After 1991 (birth rate 30.5/1000, death rate 10.2/1000), India has entered the third stage ofdemographic transition. Although the natural growth rate has declined in the decades of 1991-2001 and 2001-2011, but due to the large population base, the net population growth has been around 18 crores.
- At present, the birth rate is 21/1000 persons and the death rate is 8/1000 persons.
- Thus, the rate of population growth is still fast. The following are the reasons for rapid population growth in India:
(i) Control over famines because agricultural and industrial production increased during the five-year plans.
(ii) Improvement in medicine which led to a decrease in mortality rate.
(iii) High birth rate which was the result of socio-economic factors, cultural backwardness, hot climate.
(iv) Increase in average age i.e. life expectancy.
- Due to the expansion of family planning programmes and increase in literacy both the birth rate and death rate decreased but due to comparatively greater decline in death rate the natural growth rate still remains high.
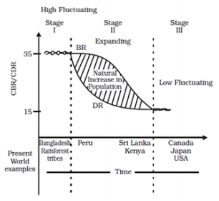
DEMOGRAPHIC TRANSITION
- Demographic Transition Theory (DTT) can be used to describe and predict the future population of any area.
- The theory tells us that the population of any region changes from high births and high deaths to low births and low deaths as society progresses from rural agrarian and illiterate to urban industrial and literate society. These changes occur in stages which are collectively known as the demographic cycle.
- In the present day, different countries are at different stages of demographic transition.
| First stage | High FertilityHigh Mortality with low Life Expectancy Low Levels of Technology |
| Second stage | Fertility remains high in the beginning of the second stage but it declines with time.This is accompanied by a reduced mortality rate. Improvements in sanitation and health conditions lead to decline in mortality. Because of this gap the net addition to population is high. |
| Last stage | Fertility and mortality declinePopulation – Urbanized |
Demographic Transition in India
- India has crossed two of the four broad phases of demographic transition. Till 1921, India was an industrial agricultural society in which the population growth rate was very low due to high birth rate and death rate. Till this time, India was in the first phase of demographic transition. From 1921 to 1991, the birth rate remained almost the same as before and a small decline was recorded in it, but due to control of famine and infectious diseases and consequent decrease in death rate, the population growth rate remained very fast. In fact, a slight decline was seen in the birth rate after 1961, but the actual growth rate was more than 2%.
| Important Facts about Census 2011 | |||
| 2001 | 2011 | Differences | |
| Population | 1,02,87,37,436 | 1,21,01,93,422 | +18,14,55,986 |
| 1. Male | 53,22,23,090 (51.73%) | 62,37,24,248 (51.54%) | +9,15,01,158 |
| 2. Female | 49,65,14,346 (48.27%) | 58,64,69,174 (48.53%) | +9,10,70,373 |
| Urban Population | 27.80% | 31.16% | +3.36% |
| Decadal Growth Rate | 21.54% | 17.64% | –3.9% |
| Annual Growth Rate | 1.97% | 1.64% | –0.33% |
| Sex Ratio | 933:1000 | 943:1000 | +10 |
| Literacy | 64.83% | 74.04% | + 9.21% |
| 1. Male | 75.26% | 82.14% | +6.88% |
| 2. Female | 53.67% | 65.46% | +11.79% |
| Density (Persons per sq km) | 324 | 382 | +58 |
Races of India
- Geographers believe that the first race to come to India was Negro (Negrito), followed by Proto-Australoid and Mediterranean races respectively and finally Nordic races.
- Proto-Australoid and Mediterranean races together started the Harappan civilization. On the basis of the evidence obtained, generally 4 types of races existed during the Harappan period.
- Proto-Australoid
- Mediterranean
- Alpine
- Mongoloid
- Dr. B.S. Guha has divided the human population of the Indian subcontinent into 6 main species :-
- Negrito/Negro
- Proto-Australoid
- Mongoloid
- Mediterranean
- Western Brachycephals
- Nardic
| Major Species | place of residence | Features |
| Negro/Negrito | In the hilly and forest areas of Andaman-Nicobar, Madhya Pradesh, Chhattisgarh, Maharashtra, Andhra Pradesh, Karnataka, Tamil Nadu, Kerala | Hair – curlyNose – broad and flatHeight – short (less than 105 cm)Skin color – darkRound head and protruding jaw |
| Proto-Australoid | Forests and hilly areas of Central and South India and North India. | Hair – WavyNose – Broad, flat and pressed downOther features are similar to Negro |
| Mongoloid | Ladakh, Sikkim, Arunachal Pradesh and other North-Eastern states. | Less hair on the body and faceFlat face and prominent cheek bones.Eyes – slanted and halfopeHeight – medium sizeColour – pale |
| Mediterranean | Punjab, Sindh, Rajasthan, Western Uttar Pradesh, South India | Less hair on body and faceColor – BrownSnake – Thin and prominentEyes – Large and open |
| Broad-headed Occidental/Shortheaded | Sindhudurga Pradesh, Gujarat, Maharashtra, Andhra Pradesh, Telangana, Karnataka, Tamil Nadu | Head – BroadHeight – Medium, short and tallFace – RoundColour – FairNose – Prominent and Long |
| Nordic | Punjab, Haryana, Rajasthan | Head – LongNose – Well developedColour – FairBody – Well built |
| States/Union Territories and the tribes | |
| Andhra Pradesh | Banjara, Lambada, Sugali, Kubi, Bagata, Savara, Chenchu, Bakla |
| Bihar | Asur, Baiga, Birhor, Birjia, Chero, Gond, Parhaiya, Santhals, Savar, Kharwar, Banjara, Oraon, Santal, Tharu |
| Chhattisgarh | Agariya, Bhaina, Bhattra, Biar, Khond, Mawasi, Nagasia, Gond, Binjhwar, Halba, Halbi, Kawar, Sawar, |
| Goa | Dhodia, Dubia, Naikda, Siddi,Varli, Gawda. |
| Gujarat | Barda, Bamcha, Bhil, Charan, Dhodia, Gamta, Paradhi, Patelia, Dhanka, Dubla, Talavia, Halpati, Kokna, Naikda, Patelia, Rathawa, Siddi. |
| Himachal Pradesh | Gaddis, Gujjars, Khas, Lamba, Lahaulas, Pangwala, Swangla, Beta, Beda Bhot, Bodh. |
| Jammu and Kashmir | Bakarwal, Balti, Beda, Gaddi, Garra, Mon, Purigpa, Sippi, Changpa, Gujjar. |
| Ladakh | Balti, Changpa, Beda, Brokpa, Drokpa, Bot |
| Jharkhand | Birhors, Bhumij, Gonds, Kharia, Mundas, Santhals, Savar, Bedia, Ho, Kharwar, Lohra, Mahli, Parhaiya, Santal, Kol, Banjara |
| Karnataka | Adiyan, Barda, Gond, Bhil, Iruliga, Koraga, Patelia, Yerava, Hasalaru, Koli Dhor, Marati , Meda, Naikda, Soligaru. |
| Kerala | Adiyan, Arandan, Eravallan, Kurumbas, Malai arayan, Moplahs, Uralis, Irular, Kanikaran, Kattunayakan, Kurichchan, Muthuvan. |
| Madhya Pradesh | Baigas, Bhils, Bharia, Birhors, Gonds, Katkari, kharia, Khond, Kol, Murias, Korku, Mawasi, Pardhan, Sahariya, |
| Maharashtra | Bhaina, Bhunjia, Dhodia, Katkari, Khond, Rathawa, Warlis, Dhanka, Halba, Kathodi, Kokna, Koli Mahadev, Pardhi, Thakur, |
| Odisha | Gadaba, Ghara, Kharia, Khond, Matya, Oraons, Rajuar, Santhals, Bathudi, Bathuri, Bhottada, Bhumij, Gond, Juang, Kisan, Kolha, Kora, Khayara, Koya, Munda, Paroja, Saora, Shabar, Lodha |
| Rajasthan | Bhils, Damaria, Dhanka, Meenas(Minas), Patelia, Sahariya, Naikda, Nayaka, Kathodi. |
| Sikkim | Bhutia, Khas, Lepchas, Limboo, Tamang |
| Tamil Nadu | Adiyan, Aranadan, Eravallan, Irular, Kadar, Kanikar, Kotas, Todas, Kurumans, Malayali, |
| Telangana | Chenchus |
| Uttar Pradesh | Bhotia, Buksa, Jaunsari, Kol, Raji, Tharu, Gond, Kharwar, Saharya , Parahiya, Baiga, Agariya, Chero |
| Uttarakhand | Bhotias, Buksa, Jannsari, Khas, Raji, Tharu. |
| West Bengal | Asur, Khond, Hajong, Ho, Parhaiya, Rabha, Santhals, Savar, Bhumij, Bhutia, Chik Baraik, Kisan, Kora, Lodha, Kheria, Khariam, Mahali, Mal Pahariya, Oraon, |
| Arunachal Pradesh | Apatanis, Abor, Dafla, Galong, Momba, Sherdukpen, Singpho, Nyishi, Mishmi, Idu, Taroan, Tagin, Adi, Monpa, Wancho |
| Assam | Chakma, Chutiya, Dimasa, Hajong, Garos, Khasis, Gangte, Karbi, Boro, Borokachari, Kachari, Sonwal, Miri, Rabha, Garo |
| Manipur | Naga, Kuki, Meitei, Aimol, Angami, Chiru, Maram, Monsang, Paite, Purum, Thadou, Anal, Mao, Tangkhul, Thadou, Poumai Naga. |
| Meghalaya | Chakma, Garos, Hajong, Jaintias Khasis, Lakher, Pawai, Raba, Mikir. |
| Mizoram | Chakma, Dimasa, Khasi, Kuki, Lakher, Pawi, Raba, Synteng, Lushai |
| Nagaland | Angami, Garo, Kachari, Kuki, Mikir, Nagas, Sema, Ao, Chakhesang, Konyak, Lotha, Phom, Rengma, Sangtam, |
| Tripura | Bhil, Bhutia, Chaimal, Chakma, Halam, Khasia, Lushai, Mizel, Namte, Mag, Munda, Riang, |
| Andaman & Nicobar | Oraons, Onges, Sentinelese, Shompens. |
| Dadra and Nagar Haveli and Daman and Diu | Kokna, Varli, Dhodia, Dubla, Varli, Ghodia, Baikada |
| Lakshadweep | Vasi |
| Puducherry | Irular (including Pilli and Vettaikkarava) |